Results for WGCNA 'female liver' tutorial data set, having 3600 probes and 135 samples
Sage Coexpression, organic correlation algorithm |
|---|
...
Sage Coexpression, WGCNA correlation algorithm | WGCNA Coexpression | WGCNA Coexpression, blocksize<=600 | |
|---|---|---|---|
Unix space ('M' field from /usr/bin/time |
...
): |
...
6471520KB (or 6.47GB) | Unix space (' |
...
M' field from /usr/bin/time): |
...
: |
...
6474832K (6.47GB) | Unix space ('M' field from /usr/bin/time): |
...
From R:
Sage Coexpression, WGCNA correlation algorithm
...
: 1958480KB (1.96GB) | Unix space: 0.4 GB |
|
Unix time('E' field from /usr/bin/time |
...
): |
...
14:04.38elapsed | Unix time('E' field from /usr/bin/time):13:33.74elapsed |
...
Unix time(' |
...
E' field from /usr/bin/time) |
...
:2:07.23elapsed | Unix time: 1m:01s |
|
Unix space #2: 6472128 (6.47GB) |
From R
:
WGCNA Coexpression
Unix time/space (from /usr/bin/time command): Time ('E' field): 2:07.23elapsed; Space ('M' field): 1958480KB (1.96GB)
...
Unix space #2: 6090192 (6.1GB) | Unix space #2: 1922800 (1.9GB) |
|
| |
Unix time #2: 11:36.09elapsed | Unix time #2: 10:58.03elapsed | Unix time #2: 1:28.53elapsed |
|
|
| | | | |
Module difference vs. this baseline (% of pairs for which the algorithm disagrees with this baseline on module co-membership): | 0 | 4.3% | 9.1% |
|
Module co-membership comparison (vs. this column as a baseline): | turquoise blue brown yellow green red grey black pink magenta purple greenyellow tan salmon cyan midnightblue lightcyan | brown yellow green red turquoise blue grey black pink magenta purple greenyellow tan salmon cyan midnightblue lightcyan grey60 | turquoise blue red green brown yellow black magenta grey pink purple greenyellow tan cyan lightcyan salmon midnightblue |
|
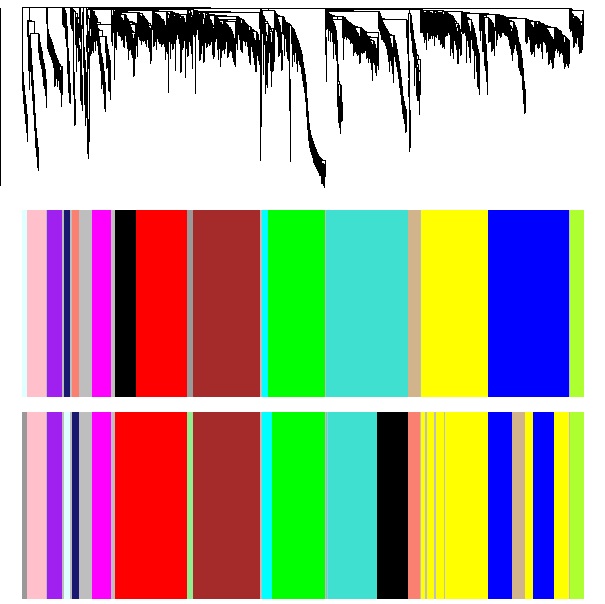
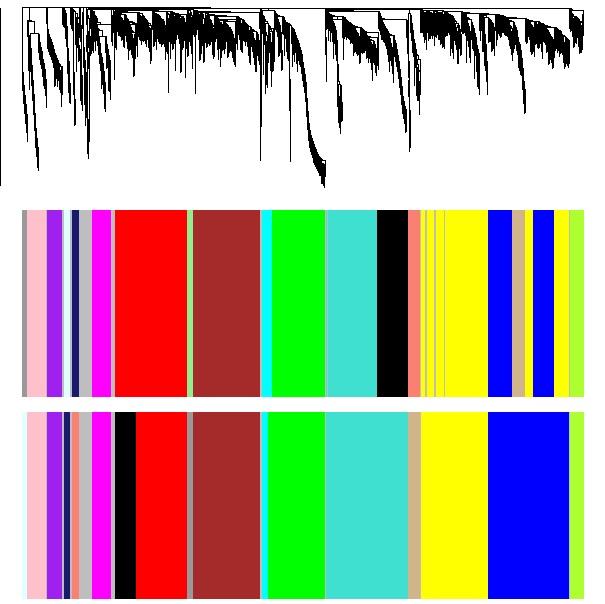
| <<< Sage dendrogram and modules, with WGCNA modules underneath, for comparison. | |
|
TOM Comparison
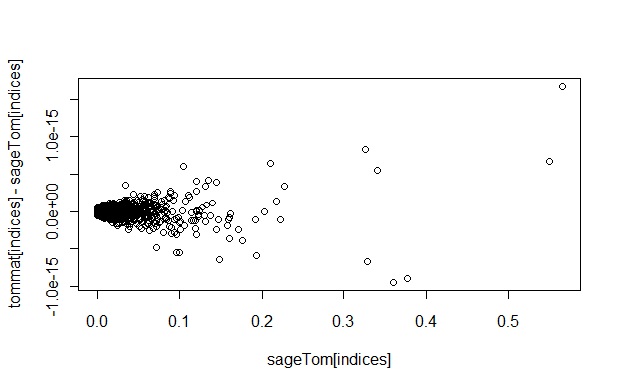
We captured the TOM matrices from the Sage and WGCNA algorithms. The values are the same (down to the machine's floating point resolution) as illustrated in this scatter plot:
Note: To make the TOM values the same for both algorithms, the default value for the WGCNA parameter "tomType" is overridden, changing it from "signed" to "unsigned". The definition of the parameter is given here:http://www.genetics.ucla.edu/labs/horvath/CoexpressionNetwork/Rpackages/WGCNA/OldPackages/WGCNA_0.67-2.pdf
- TOMType: a character string specifying TOM type to be calculated. One of "unsigned", "signed". If "unsigned", the standard TOM will be used (more generally, TOM function will receive the adjacency as input). If "signed", TOM will keep track of the sign of the adjacency between neighbors. ... If TOMType = "unsigned", entries of the adjacency matrix are required to lie between 0 and 1; for TOMType = "signed" they can be between -1 and 1.
The TOM values are the inputs to the clustering algorithms. The dendrograms appear nearly identical above, therefore it seems the differences between the two algorithms are in the module determination from the dendrograms.
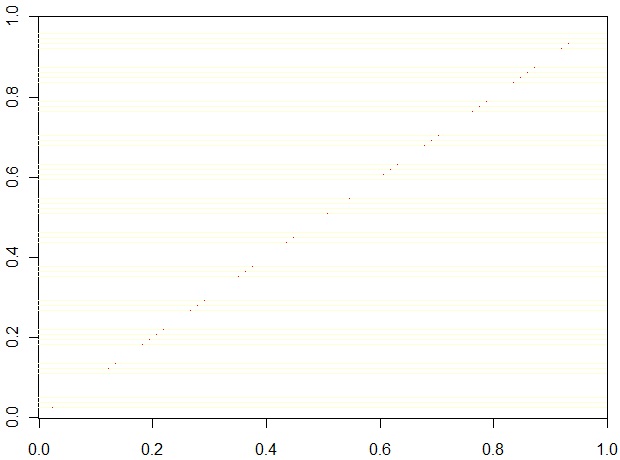
To compare the dendrogram similarity, we permute the rows of a 3600x3600 diagonal matrix according to the leaf permutations of one of the two dendrograms and the columns according to the other. Identical dendrograms cause the diagonal to be retained, as seen in this result:
Analysis of the effect of dividing genes into 'blocks'
WGCNA, one block | WGCNA, 7 blocks (block size < 600) |
|---|---|
Module difference vs. this baseline (% of pairs for which the algorithm disagrees with this baseline on module co-membership): | 7.5% |
Module co-membership comparison (vs. this column as a baseline): | 1 3 2 5 4 7 6 13 10 16 11 8 0 17 14 15 12 18 9 19 20 22 21 |


